Democracy Status
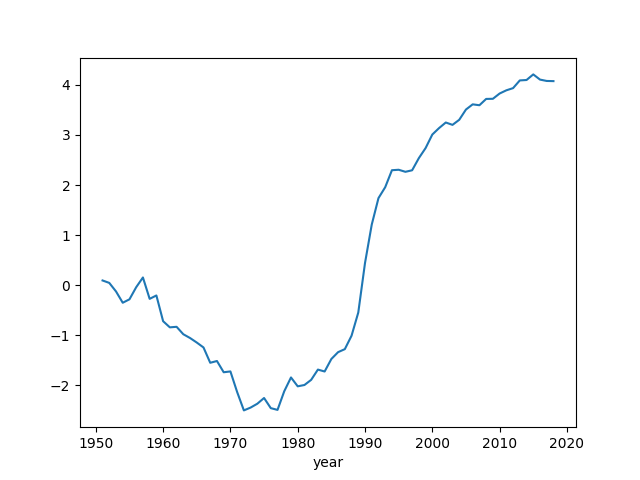
Polity
Here is democracy status from the Polity dataset. Their DEMOC and
AUTOC columns contain the level of insititutional leanings of a
country, POLITY column is one subtracted from the other, it ranges
btw -10 and +10, the latter being full democracy.
import pandas as pd
df = pd.read_excel('../../mbl/2020/p4v2018.xls')
df = df[df.year > 1950]
df.loc[df.polity < -10, 'polity'] = np.nan
df['polity'] = df['polity'].interpolate(method='linear')
polity = df.groupby('year')['polity'].mean()
polity.plot()
plt.savefig('polity-all.png')
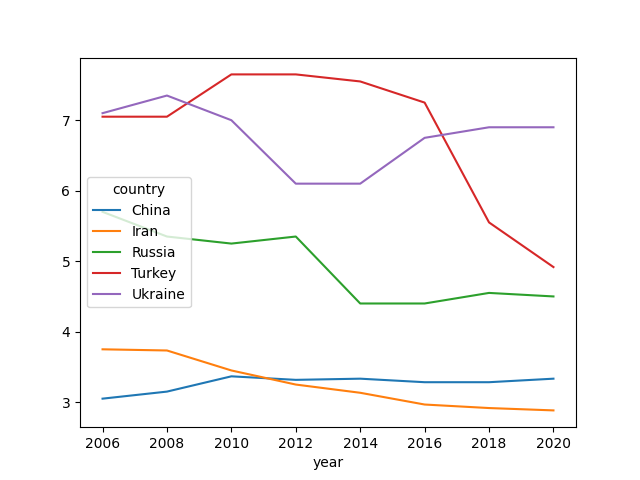
BTI
Data comes from the BTI Transformation Index that evaluates aspects of governance for selected countries, recently updated for 2020.
import pandas as pd
df = pd.read_stata('../../mbl/2020/BTI 2006-2020.dta')
df1 = df[['country','dem_stat','year']]
df1 = df1[df1.country.isin(['Russia','Turkey','Iran','China','Ukraine'])]
df1=df1.pivot(index='year', columns='country', values='dem_stat')
df1.plot()
plt.savefig('bti-compare.png')
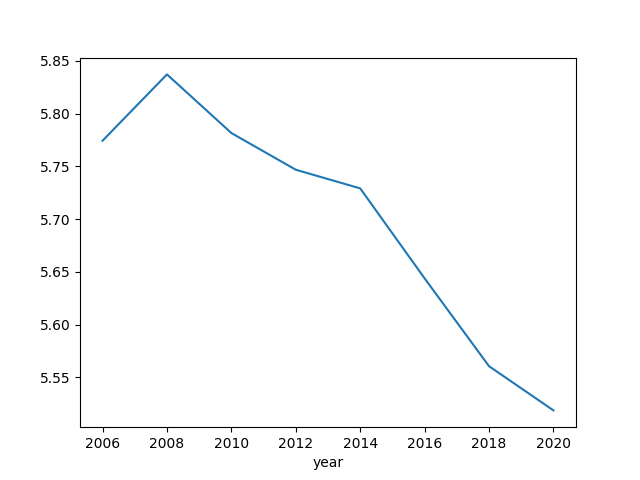
import pandas as pd
df = pd.read_stata('../../mbl/2020/BTI 2006-2020.dta')
g = df.groupby('year').dem_stat.mean()
g.plot()
plt.savefig('bti-all.png')
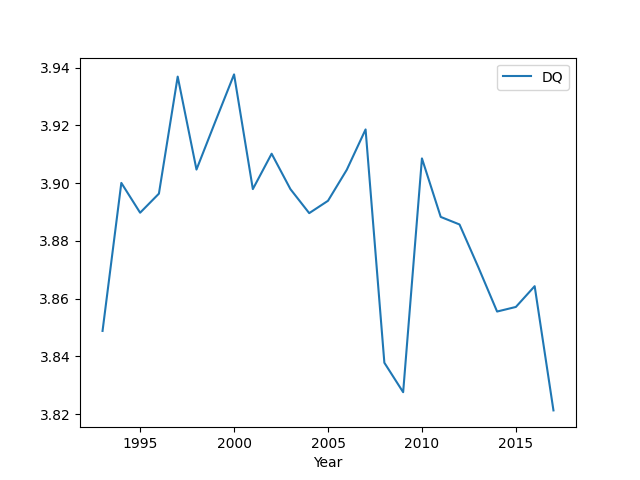
Democracy Barometer
import zipfile
with zipfile.ZipFile('db.zip', 'r') as z:
   df = pd.read_csv(z.open('DB_data_2020_all_data_Standardised.csv'),sep=';')
   df = df[['Year','DQ']].groupby('Year').mean()
   print (df.tail(5))
   df.plot()

plt.savefig('db-all.png')
            DQ
Year
2013  3.870913
2014  3.855549
2015  3.857140
2016  3.864331
2017  3.821315
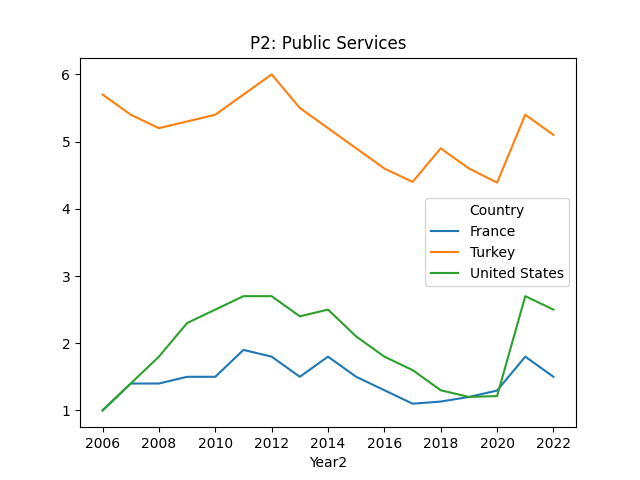
The Fragile States Index
The Fragile States Index (FSI) produced by The Fund for Peace (FFP), attemps to highlight pressures that states experience, through its various measures and a final score (lower is better) that shows how fragile a state is.
import pandas as pd
df = pd.read_csv('fsi.csv')
df['Year2'] = df.apply(lambda x: pd.to_datetime(x['Year']).year, axis=1)
df = df[df.Country.isin(['United States','France','Turkey'])]
c = 'P2: Public Services'
df2 = df[['Country','Year2',c]]
df2=df2.pivot(index='Year2', columns='Country', values=c)
df2.plot(title=c)
plt.savefig('fsi1.png')
c = 'P1: State Legitimacy'
df2 = df[['Country','Year2',c]]
df2=df2.pivot(index='Year2', columns='Country', values=c)
df2.plot(title=c)
plt.savefig('fsi2.png')

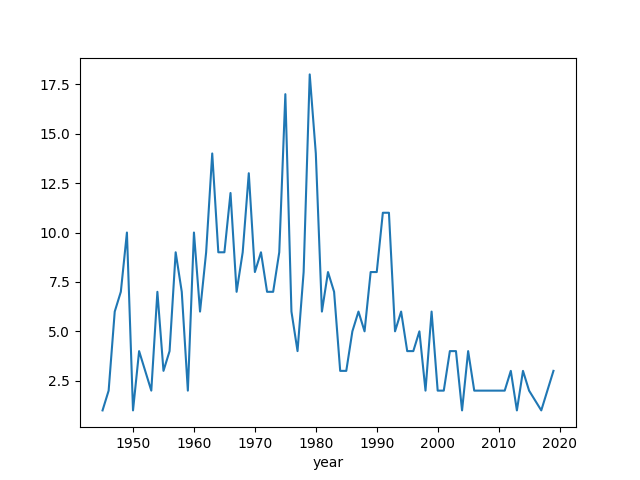
Coups
Worldwide annual counts of military interventions. Based on Cline Center Coup D’état Project Dataset
import pandas as pd
df = pd.read_csv('Coup_Data_v2.0.0.csv')
df = df[df['event_type'] == 'coup']
g = df.groupby('year').size()
print (g.tail(5))
year
2013    1
2014    3
2015    2
2017    1
2019    3
dtype: int64
g.plot()
plt.savefig('coups.png')