Police, Crime in US
People Shot By the Police
Data is from WaPo Github repo.
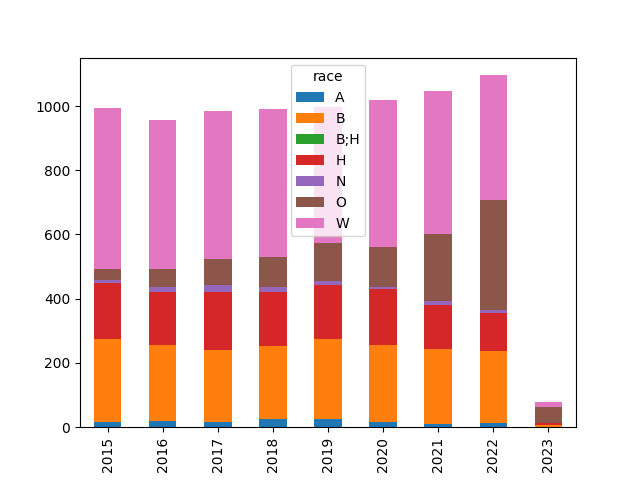
All Deaths by Police Shootings, by Race
import pandas as pd

f = 'https://raw.githubusercontent.com/washingtonpost/data-police-shootings/master/v2/fatal-police-shootings-data.csv'
df = pd.read_csv(f)
df['year'] = pd.to_datetime(df['date']).dt.year
df['race'] = df['race'].fillna('O')
g = df.groupby(['year','race']).size().reset_index()
g = g.set_index(['year','race']).unstack(level=1)[0]
g.plot.bar(stacked=True)
plt.savefig('allshoot.png')
A: Asian, B: Black, H: Hispanic, N: Native Am, O: Other, W: White
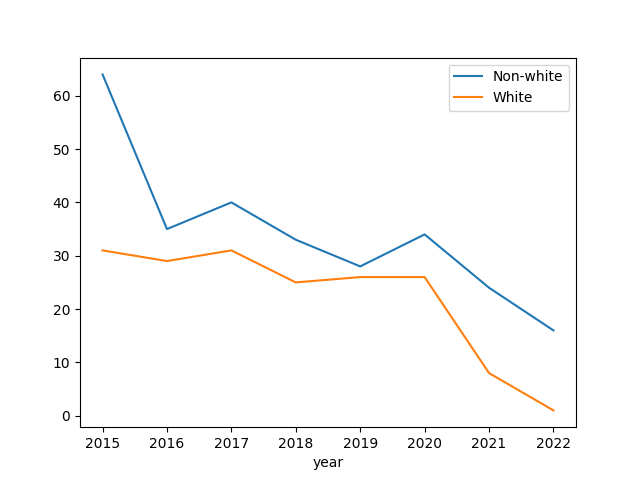
Unarmed People Shot by the Police
df = pd.read_csv(f)
df['year'] = pd.to_datetime(df['date']).dt.year
df1 = df[(df.race != 'W') & (df.armed == 'unarmed')]
df1.groupby('year').size().plot()
df2 = df[(df.race == 'W') & (df.armed == 'unarmed')]
df2.groupby('year').size().plot()
plt.legend(['Non-white','White'])
plt.savefig('unarmed.png')
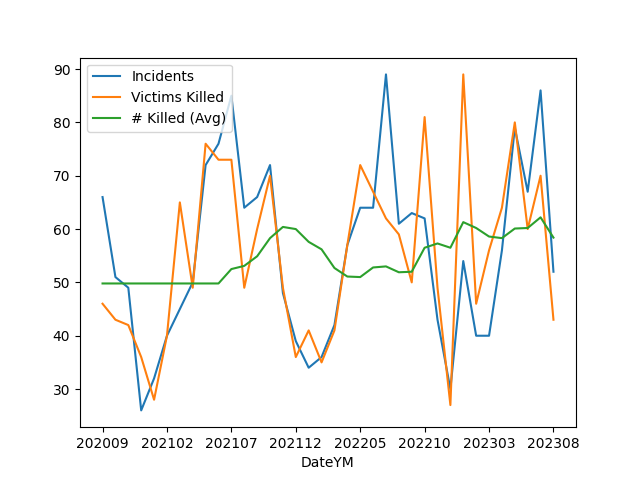
US Gun Violence
Data came from the Gun Violence Archive, see data for "mass shootings - all years". Plot is monthly incidents and deaths.
import pandas as pd, zipfile
pd.set_option('display.max_columns', None)
df =  pd.read_csv('us-mass-shootings.csv')
df['Date'] = df.apply(lambda x: pd.to_datetime(x['Incident Date']), axis=1)
df['DateYM'] = df.apply(lambda x: "%d%02d" % (x['Date'].year, x['Date'].month), axis=1)
g = df.groupby('DateYM').agg({'Incident ID':'count', 'Victims Killed': 'sum'})
g['# Killed (Avg)'] = g['Victims Killed'].rolling(10).mean()
g = g.interpolate(limit_direction='both')
g = g.rename(columns={"Incident ID": "Incidents"})
print (g.tail(5))
g.plot()
plt.savefig('gunvio.png')
        Incidents  Victims Killed  # Killed (Avg)
DateYM
202304         56              64            58.3
202305         79              80            60.1
202306         67              60            60.2
202307         86              70            62.2
202308         52              43            58.4
FBI Crime Data, UCR
The FBI site [4] and data.gov API publishes crime data. Data from the
first the so-called "Table 8" is for 1999-2019. The rest from the API,
see the zip below [3]. The xls to csv conversion code is in util.py.
In order to retrieve an entire year from the API data is retrieved for
each agency (PDs), the master list is in agencies.csv. Sign-up and
get the key [2].
Example,
import requests, json

agency = "AL0010100" # Bessemer Police Department
year = 2019

key = open("../../0119/2019/05/.key/.datagov").read()
url = "https://api.usa.gov/crime/fbi/sapi/api/summarized/agencies/%s/offenses/%d/%d?api_key=%s" % (agency,year,year,key)
response = requests.get(url)
res = json.loads(response.text)
res['results'][0]
Out[1]:
{'ori': 'AL0010100',
 'data_year': 2019,
 'offense': 'aggravated-assault',
 'state_abbr': 'AL',
 'cleared': 3,
 'actual': 319,
 'data_range': None}
res['results'][1]
Out[1]:
{'ori': 'AL0010100',
 'data_year': 2019,
 'offense': 'arson',
 'state_abbr': 'AL',
 'cleared': 0,
 'actual': 0,
 'data_range': None}
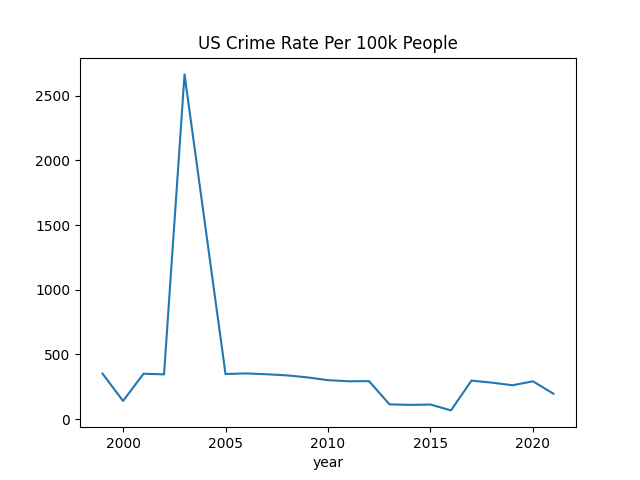
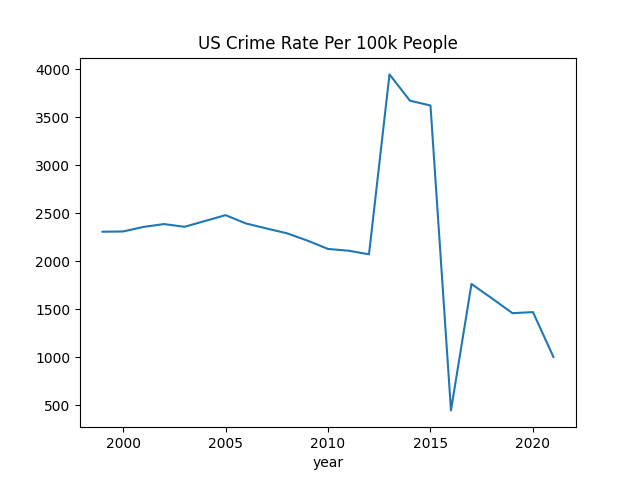
Crime Rates
import fbi
df = fbi.crime_annual_summary(['homicide','rape','robbery','aggravated-assault'])
df.rate.plot(title='US Crime Rate Per 100k People')
plt.savefig('rate1.png')
df = fbi.crime_annual_summary(['burglary','larceny','motor-vehicle-theft','arson'])
df.rate.plot(title='US Crime Rate Per 100k People')
plt.savefig('rate2.png')
References
[1] FBI
[2] Data.gov signup
[3] Data (zip, 10 MB)